


This section provides a snapshot of persons with mental health and addiction disabilities. It also looks at these socio-economic indicators: housing, education, labour force, discrimination in the workplace and income.
3.1. Prevalence of disability
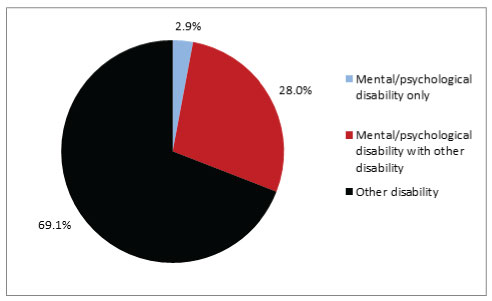
Figure 1. Prevalence of disability among adults aged 15 and older, Ontario, 2012

Source: Adapted from Statistics Canada, Custom Tabulation, Canadian Survey on Disability, 2012.
Percentages are rounded to the nearest one decimal point.
E use with caution.
Overall, 15.4% of Ontarians aged 15 and over report having a disability, with 4.8% reporting a mental health disability or addiction and 10.6% reporting another disability.
Figure 2. Prevalence of disability among adults with disabilities aged 15 and older by disability type, Ontario, 2012
Source: Adapted from Statistics Canada, Custom Tabulation, Canadian Survey on Disability, 2012.
Percentages are rounded to the nearest one decimal point.
E use with caution.
Of people in Ontario who report a disability, almost one-third (30.9%) report a mental health or addiction disability, and 69.1% report another type of disability. The 30.9% includes 2.9% of people with disabilities who report that their sole disability type is a mental health or addiction disability (see Figure 2).
A slightly greater proportion of Ontarians (4.8%) report mental health and addiction disabilities compared to people across Canada (3.9%). Similarly, a slightly greater proportion of Ontarians report other disabilities (10.6%) compared to Canada (9.9%) (see Table 1).
Table 1. Prevalence of disability among adults aged 15 and older, Ontario and Canada, 2012
|
|
Ontario |
Canada |
||
|
Disability |
Number |
% |
Number |
% |
|
Mental/psychological disability |
510,280 |
4.8 |
1,059,600 |
3.9 |
|
Other disability
|
1,141,340 |
10.6 |
2,716,320 |
9.9 |
|
Total disability
|
1,651,620 |
15.4 |
3,775,910 |
13.7 |
|
No disability
|
9,076,280 |
84.6 |
23,740,290 |
86.3 |
Source: Adapted from Statistics Canada, Custom Tabulation, Canadian Survey on Disability, 2012.
Percentages are rounded to the nearest one decimal point.
E use with caution.
3.1.1. Multiple disabilities
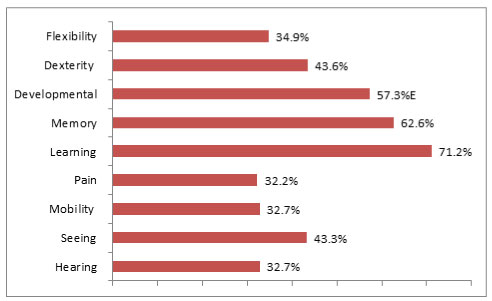
Figure 3. Prevalence of mental/psychological disabilities among adults aged 15 and older with other disability types, Ontario, 2012
Source: Adapted from Statistics Canada, Custom Tabulation, Canadian Survey on Disability, 2012; Statistics Canada, Canadian Survey on Disability, 2012, Data Tables, 2013, Statistic Canada Catalogue no. 89‑654‑X — No. 001
Percentages are rounded to the nearest one decimal point.
E use with caution. Note: Percentages do not total 100 due to people reporting multiple disabilities.
It is very common for people to have mental health and addiction disabilities along with other disabilities. The vast majority of Ontarians with mental health or addiction disabilities (90.5%) report another type of disability. This compares to 91.7% of people with mental health and addiction disabilities across Canada (see Table 2). More than 30% of people who have a hearing, seeing or other disability also report a mental health or addiction disability. People with learning (71.2%), memory (62.6%) and developmental disabilities (57.3%) are most likely to report mental health and addiction disabilities (see Figure 3 and Table 3).
Table 2. Prevalence of co-occurring disabilities among adults aged 15 and over, Ontario and Canada, 2012
|
|
Ontario |
Canada |
||
|
Disability type |
Number |
% |
Number |
% |
|
Mental/psychological disability only |
48,650E
|
9.5E |
87,640
|
8.3
|
|
Mental/psychological disability with other disability |
461,630
|
90.5
|
971,960
|
91.7
|
Source: Adapted from Statistics Canada, Custom Tabulation, Canadian Survey on Disability, 2012; Statistics Canada, Canadian Survey on Disability, 2012, Data Tables, 2013, Catalogue no. 89‑654‑X — No. 001
Percentages are rounded to the nearest one decimal point.
E use with caution.
Table 3. Prevalence of disability among adults with disabilities aged 15 and older by disability type and co-occurring mental/psychological disability, Ontario, 2012
|
|
Prevalence |
Prevalence with mental/psychological disability |
||
|
Type of disability
|
Number |
%* |
Number |
%** |
|
Total population with disabilities |
1,651,620 |
|
510,280 |
|
|
Flexibility disability |
971,630 |
58.8 |
338,820 |
34.9 |
|
Dexterity disability |
450,940 |
27.3 |
196,390 |
43.6 |
|
Developmental disability |
73,040 |
4.4 |
41,860E |
57.3E |
|
Memory disability |
303,140 |
18.4 |
189,780 |
62.6 |
|
Learning disability |
283,980 |
17.2 |
202,170 |
71.2 |
|
Pain disability |
1,191,230 |
72.1 |
383,650 |
32.2 |
|
Mobility disability |
857,690 |
51.9 |
280,360 |
32.7 |
|
Seeing disability |
331,930 |
20.1 |
143,600 |
43.3 |
|
Hearing disability |
391,100 |
23.7 |
127,920 |
32.7 |
Source: Adapted from Statistics Canada, Custom Tabulation, Canadian Survey on Disability, 2012; Statistics Canada, Canadian Survey on Disability, 2012, Data Tables, 2013, Catalogue no. 89‑654‑X — No. 001
Percentages are rounded to the nearest one decimal point.
E use with caution. Note: Percentages do not total 100 due to people reporting multiple disabilities.
* This column represents people with each disability type as a proportion of the total population with disabilities (including mental/psychological disabilities).
** This column represents the percentage of people with each disability type (hearing, etc.) who also have a mental/psychological disability.
3.1.2. Severity of disability
People whose disabilities are more severe have higher unemployment rates, are more likely to be prevented from looking for work due to disability, and are less likely to take part in civic life and social activities, compared to people with milder disabilities. They are more likely to need supports such as workplace accommodation, medical professionals, tend to spend more money on health visits, and are more likely to need assistive devices.[16] Overall, people with more severe disabilities face greater barriers to participation than people without disabilities and people with less severe disabilities.
When calculating the severity of people’s disabilities, Statistics Canada uses a global severity “score,” based on the average severity of all disability types. Overall, the global severity score:
- Increases with the number of disability types
- Increases with the level of difficulty associated with the disability
- Increases with the frequency of the activity limitation.[17]
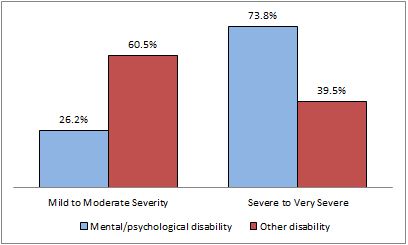
In Ontario, a much greater proportion of people with mental health and addiction disabilities have a severe or very severe disability (73.8%) compared to people with other disabilities (39.5%) (see Figure 4).
Figure 4. Severity of disability among adults aged 15 and older by disability type and severity level, Ontario, 2012
Source: Adapted from Statistics Canada, Custom Tabulation, Canadian Survey on Disability, 2012.
Percentages are rounded to the nearest one decimal point.
E use with caution.
Table 4. Severity of disability among adults aged 15 and older by disability type and severity level, Ontario and Canada, 2012
|
|
Ontario |
Canada |
||||||
|
Disability |
Mental/psychological |
Other disability |
Mental/psychological |
Other disability |
||||
|
Severity level |
Number |
% |
Number |
% |
Number |
% |
Number |
% |
|
Mild to moderate |
133,480 |
26.2 |
690,250 |
60.5 |
292,040 |
27.6 |
1,651,520 |
60.8 |
|
Severe to very severe |
376,810 |
73.8 |
451,080 |
39.5 |
767,560 |
72.4 |
1,064,800 |
39.2 |
Source: Adapted from Statistics Canada, Custom Tabulation, Canadian Survey on Disability, 2012
Percentages are rounded to the nearest one decimal point.
E use with caution.
3.2. Prevalence of disability and other intersecting Code grounds
The OHRC examined the reported incidence of mental health and addiction disabilities among Ontarians who identify with other Code grounds. In Minds that Matter, the OHRC heard that people who have a mental health disability or addiction and are from other marginalized communities (such as women, racialized or Indigenous peoples, gay, lesbian or bisexual people, and trans people) face unique and distinct forms of discrimination, called “intersectional discrimination.” Similarly, the OHRC heard that people from marginalized Code-protected groups are more likely than others to develop mental health and addiction disabilities, in part due to discrimination.
The demographic groups analyzed relate to the Code grounds of sex, age, race and related grounds such as place of origin, ethnic origin and ancestry, as well as marital status and family status.
3.2.1. Sex
Table 5. Prevalence of disability among adults aged 15 and older by disability type and sex, Ontario and Canada, 2012
|
|
Ontario |
Canada |
||||||
|
Sex |
Women |
Men |
Women |
Men |
||||
|
Disability |
Number |
% |
Number |
% |
Number |
% |
Number |
% |
|
Mental/ |
271,810 |
5 |
238,470 |
4.5 |
595,060 |
4.3 |
464,540 |
3.4 |
|
Other disability
|
647,740 |
11.8 |
493,600 |
9.4 |
1,481,830 |
10.6 |
1,234,480 |
9.1 |
Source: Adapted from Statistics Canada, Custom Tabulation, Canadian Survey on Disability, 2012.
Percentages are rounded to the nearest one decimal point.
E use with caution.
A slightly greater proportion of women aged 15 and older in Ontario report a mental health and addiction disability (5%) compared to men (4.5%). A greater proportion of women in Ontario report having other disabilities (11.8%) than men (9.4%).
A slightly greater proportion of women in Ontario report mental health and addiction disabilities (5%) than women in Canada (4.3%). A slightly greater proportion of men in Ontario (4.5%) report mental health and addiction disabilities compared to men across Canada (3.4%).
This result is similar for people with other disabilities. Greater proportions of men (9.4%) and women (11.8%) in Ontario report other disabilities compared to men (9.1%) and women (10.6%) across Canada.
3.2.2. Age
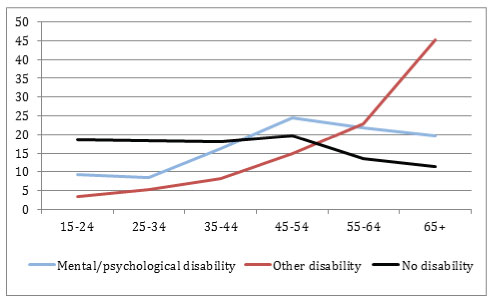
Figure 5. Age distribution among adults, aged 15 and older, by disability status, Ontario, 2012
Source: Adapted from Statistics Canada, Custom Tabulation, Canadian Survey on Disability, 2012.
Percentages are rounded to the nearest one decimal point.
E use with caution.
A greater proportion of people with mental health and addiction disabilities are younger (15-34 years – 17.7%) and in mid-life (35-54 years – 40.6%) compared to people with other disabilities (8.8% and 23% respectively). People aged 15-24 account for 9.3% of all Ontarians who report mental health and addiction disabilities, more than twice the proportion of people with other disabilities (3.5%) (see Table 6).
Table 6. Age distribution among adults, aged 15 and older by disability status, Ontario, 2012
|
|
Ontario |
|||||
|
Disability status |
Mental/psychological |
Other disability |
No disability |
|||
|
Age |
Number |
% |
Number |
% |
Number |
% |
|
15-24 |
47,390E |
9.3E |
40,310 |
3.5 |
1,694,450 |
18.7 |
|
25-34 |
42,940 |
8.4 |
60,210 |
5.3 |
1,673,510 |
18.4 |
|
35-44 |
82,090 |
16.1 |
92,140 |
8.1 |
1,649,680 |
18.2 |
|
45-54 |
125,180 |
24.5 |
170,340 |
14.9 |
1,782,250 |
19.6 |
|
55-64 |
111,870 |
21.9 |
262,620 |
23 |
1,230,930 |
13.6 |
|
65+ |
100,810 |
19.8 |
515,720 |
45.2 |
1,045,460 |
11.5 |
Source: Adapted from Statistics Canada, Custom Tabulation, Canadian Survey on Disability, 2012.
Percentages are rounded to the nearest one decimal point.
E use with caution.
3.2.3. Indigenous peoples
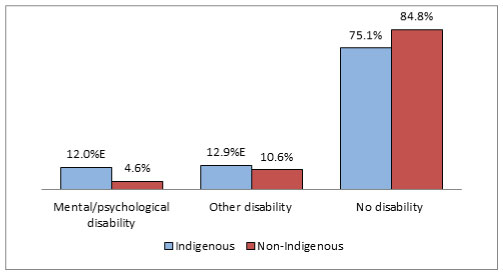
Figure 6. Prevalence of disability among adults aged 15 and older by Indigenous identity and disability status, Ontario, 2011
Source: Adapted from Statistics Canada, Custom Tabulation, Canadian Survey on Disability, 2012.
Percentages are rounded to the nearest one decimal point.
E use with caution.
Overall, the proportion of Indigenous peoples[18] in Ontario living off reserve who report any kind of disability (24.9%) is greater than the proportion of non-Indigenous people who report disabilities (15.2%) and the proportion of Indigenous peoples across Canada who report disabilities (18.6%).
In Ontario, 12% of Indigenous peoples aged 15 and over living off reserve report a mental health or addiction disability, compared to 4.6% of people who are not Indigenous. A greater proportion of Indigenous peoples in Ontario (12%) report mental health and addiction disabilities compared to across Canada (6.6%).
Table 7. Prevalence of disability among adults aged 15 and older by Indigenous identity and disability type, Ontario and Canada, 2011
|
|
Ontario |
Canada |
||||||
|
Identity |
Indigenous |
Non-Indigenous |
Indigenous |
Non-Indigenous |
||||
|
Disability |
Number |
% |
Number |
% |
Number |
% |
Number |
% |
|
Mental/ psychological disability
|
22,360E |
12.0E |
487,920 |
4.6 |
52,330 |
6.6 |
1,007,270 |
3.8 |
|
Other disability |
24,040E |
12.9E |
1,117,300 |
10.6
|
94,580 |
12.0 |
2,621,260 |
9.8 |
|
Total disability
|
46,400E |
24.9E |
1,605,220 |
15.2 |
146,900 |
18.6 |
3,628,530 |
13.6 |
|
No disability |
140,270
|
75.1 |
8,936,020 |
84.8 |
643,460 |
81.4 |
23,096,830 |
86.4 |
Source: Adapted from Statistics Canada, Custom Tabulation, Canadian Survey on Disability, 2012.
Percentages are rounded to the nearest one decimal point.
E use with caution.
3.2.4. Racialized people
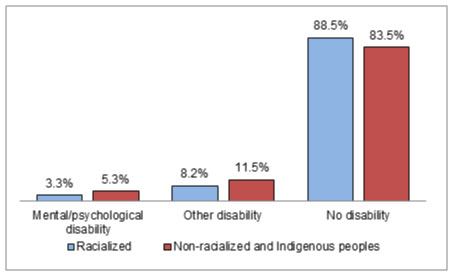
Figure 7. Prevalence of disability among adults aged 15 and older by racialized identity and disability status, Ontario, 2011
Source: Adapted from Statistics Canada, Custom Tabulation, Canadian Survey on Disability, 2012.
Percentages are rounded to the nearest one decimal point.
E use with caution.
The racialized population[19] may be associated with the Code grounds of race, ethnic origin, colour and place of origin. The data on the racialized population in this report uses Statistics Canada’s variable for the “visible minority” population.[20] Statistics Canada does not include Indigenous peoples as “visible minorities.”
In Ontario, a smaller proportion of racialized people (3.3%) report mental health and addiction disabilities than indigenous peoples and non-racialized people (5.3% combined). The same can be observed for other types of disabilities (8.2% versus 11.5%).
A slightly greater proportion of racialized people in Ontario report mental health and addiction disabilities (3.3%) compared to Canada (2.7%) - See Table 8.
Table 8. Prevalence of disability among adults aged 15 and older by racialized identity and disability status, Ontario and Canada, 2011
|
|
Ontario |
Canada |
||||||
|
Identity |
Racialized people |
Non-racialized people and Indigenous peoples |
Racialized people |
Non-racialized people and Indigenous peoples |
||||
|
Disability |
Number |
% |
Number |
% |
Number |
% |
Number |
% |
|
Mental/ psychological disability |
87,920 |
3.3 |
422,360 |
5.3 |
139,570 |
2.7 |
920,030 |
4.1 |
|
Other disability |
221,530 |
8.2 |
919,810 |
11.5 |
369,410 |
7.3 |
2,346,420 |
10.5 |
|
No disability
|
2,385,260 |
88.5 |
6,691,020 |
83.3 |
4,577,520 |
90 |
19,162,770 |
85.4 |
Source: Adapted from Statistics Canada, Custom Tabulation, Canadian Survey on Disability, 2012.
Percentages are rounded to the nearest one decimal point.
E use with caution.
3.2.5. Marital status
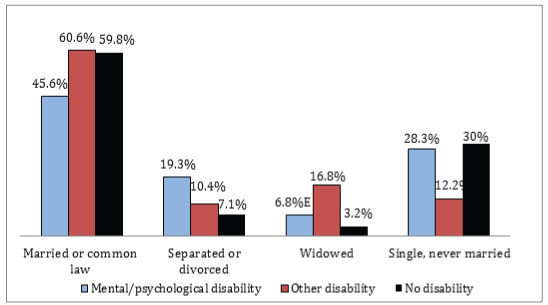
Figure 8. Marital status of adults aged 15 and older by marital status category and disability status, Ontario, 2011
Source: Adapted from Statistics Canada, Custom Tabulation, Canadian Survey on Disability, 2012.
Percentages are rounded to the nearest one decimal point.
E use with caution. Notes: Missing values are included. Percentages do not total 100.
The proportion of people with mental health and addiction disabilities who are single and never married (28.3%) is similar to people without disabilities (30%). A much smaller proportion of people with other disabilities are single or never married (12.2%) compared to these groups. However, a greater proportion of people with mental health and addiction disabilities are separated or divorced (19.3%) compared to people with other disabilities (10.4%) and people without disabilities (7.1%).
A smaller proportion of people with mental health or addiction disabilities in Ontario are married or in a common-law relationship (45.6% for both categories) than people with other disabilities (60.6%) or people without disabilities (59.8%).
People with other disabilities represent the greatest proportion of people who are married or in common-law relationships (60.6% for both categories) or are widowed (16.8%). As noted in the section on age, people who have other disabilities are often older people, which may account for a greater proportion of this group being widowed.
Table 9. Marital status of adults aged 15 and older by marital status category and disability status, Ontario, 2011
|
|
Ontario |
|||||
|
Disability |
Mental/psychological disability |
Other disability |
No disability |
|||
|
Marital status |
Number |
% |
Number |
% |
Number |
% |
|
Married and not separated |
203,090
|
39.8
|
630,380
|
55.2
|
4,715,550
|
52
|
|
Common-law |
29,710E |
5.8E |
61,230 |
5.4 |
710,370 |
7.8
|
|
Separated but still legally married or divorced |
98,330 |
19.3 |
119,120 |
10.4 |
640,340 |
7.1 |
|
Widowed
|
34,600E |
6.8E |
191,380 |
16.8 |
285,950 |
3.2 |
|
Single, never married
|
144,550 |
28.3 |
139,230 |
12.2 |
2,724,080 |
30 |
Source: Adapted from Statistics Canada, Custom Tabulation, Canadian Survey on Disability, 2012.
Percentages are rounded to the nearest one decimal point.
E use with caution. Notes: Missing values are included. Percentages do not add total 100.
3.2.6. Families
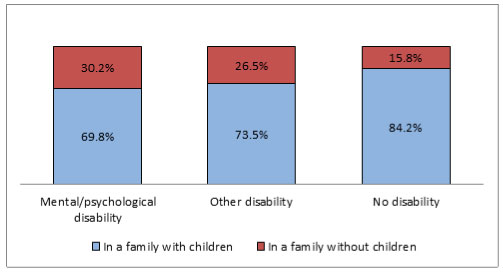
Figure 9. Family composition of adults aged 15 and older by disability status and presence of children, Ontario, 2011
Source: Adapted from Statistics Canada, Custom Tabulation, Canadian Survey on Disability, 2012.
Percentages are rounded to the nearest one decimal point.
E use with caution. Note: Missing values are included.
A greater proportion of people with mental health and addiction disabilities in Ontario, aged 15 and older, live in families without children (30.2%), than people with other types of disabilities (26.5%) and people without disabilities (15.8%).
A slightly higher proportion of people with mental health and addiction disabilities in Ontario live in families with children[21] (69.8%) than across Canada (67.7%). This is similar for people with other disabilities (73.5% in Ontario versus 72.2% across Canada) (see Table 10).
Table 10. Family composition of adults aged 15 and over by disability status and presence of children, Ontario and Canada, 2011
|
|
Ontario |
Canada |
||||||
|
Presence of |
In a family with children |
In a family without children |
In a family with children |
In a family without children |
||||
|
Disability |
Number |
% |
Number |
% |
Number |
% |
Number |
% |
|
Mental/ psychological disability |
356,140
|
69.8
|
154,150
|
30.2
|
717,020
|
67.7
|
342,580
|
32.3
|
|
Other disability |
838,680
|
73.5
|
302,650
|
26.5
|
1,960,390
|
72.2
|
755,440
|
27.8
|
|
No disability |
7,642,000
|
84.2
|
1,434,280
|
15.8
|
19,518,290
|
82.2
|
4,222,000
|
17.8
|
Source: Adapted from Statistics Canada, Custom Tabulation, Canadian Survey on Disability, 2012.
Percentages are rounded to the nearest one decimal point.
E use with caution. Note: Missing values are included. Percentages do not total 100.
3.2.7. People in the household
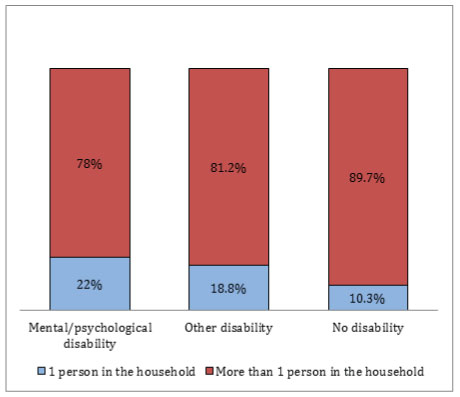
Figure 10. Household composition of adults aged 15 and oolder by disability status and number of persons, Ontario, 2011
Source: Adapted from Statistics Canada, Custom Tabulation, Canadian Survey on Disability, 2012.
Percentages are rounded to the nearest one decimal point.
E use with caution. Note: Missing values are included.
A greater proportion of people with mental health and addiction disabilities in Ontario aged 15 and over live alone (22%) than people with other types of disabilities (18.8%) and people without disabilities (10.3%). The proportion of people with mental health and addiction disabilities who live alone in Ontario (22%) is slightly smaller than across Canada (24%).
Table 11. Household composition of adults aged 15 and older by disability status and number of persons, Ontario and Canada, 2011
|
|
Ontario |
Canada |
||||||
|
Numner of |
One person households |
Households with more than one person |
One person households |
Households with more than one person |
||||
|
Disability |
Number |
% |
Number |
% |
Number |
% |
Number |
% |
|
Mental/ psychological disability |
112,490 |
22 |
397,790 |
78 |
254,150 |
24 |
805,440 |
76 |
|
Other disability |
214,040 |
18.8 |
927,300 |
81.2 |
567,590 |
20.9 |
2,148,240 |
79.1 |
|
No disability
|
936,700 |
10.3 |
8,139,580 |
89.7 |
2,842,320 |
12 |
20,897,980 |
88 |
Source: Adapted from Statistics Canada, Custom Tabulation, Canadian Survey on Disability, 2012.
Percentages are rounded to the nearest one decimal point.
E use with caution. Note: Missing values are included.
3.3. Housing
Affordable and adequate housing is a necessity for everyone in Ontario and across Canada. The international community has long recognized that housing is a fundamental and universal human right, through international treaties such as the International Covenant on Economic, Social and Cultural Rights (ICESCR), which Canada has ratified. The Convention on the Rights of Persons with Disabilities (CRPD) also outlines the rights of people with disabilities to an adequate standard of living and social protection, which includes the right to housing (Article 28).
Looking at how many people lack housing that is adequate, affordable and suitable is another way to assess social and economic disparities between people with disabilities and people without disabilities.
This section examines four aspects of housing:
- Housing tenure (owned or rented)
- Core housing need
- Dwelling structure
- Number of bedrooms.
3.3.1. Housing tenure
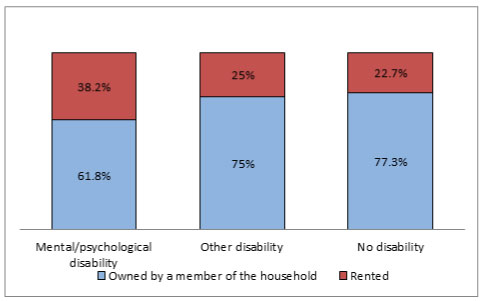
Figure 11. Housing tenure of adults aged 15 and older by disability status and type of tenure Ontario, 2011
Source: Adapted from Statistics Canada, Custom Tabulation, Canadian Survey on Disability, 2012.
Percentages are rounded to the nearest one decimal point.
E use with caution. Note: “Other” and “not specified” responses are excluded.
In Ontario, a greater proportion of people with mental health or addiction disabilities aged 15 and oolder live in rented housing (38.2%) compared to people with other disabilities (25%) and people without disabilities (22.7%).
Table 12. Housing tenure of adults aged 15 and older by disability status and type of tenure, Ontario and Canada, 2011
|
|
Ontario |
Canada |
||||||
|
Type of |
Owned by a member of the household |
Rented |
Owned by a member of the household |
Rented |
||||
|
Disability |
Number |
% |
Number |
% |
Number |
% |
Number |
% |
|
Mental/ psychological disability |
315,320 |
61.8 |
194,970 |
38.2 |
647,420 |
61.1 |
412,120 |
38.9 |
|
Other disability |
856,470 |
75 |
284,870 |
25 |
2,017,080 |
74.3 |
698,610 |
25.7 |
|
No disability |
7,018,540 |
77.3 |
2,057,690 |
22.7 |
17,843,500 |
75.2 |
5,894,880 |
24.8 |
Source: Adapted from Statistics Canada, Custom Tabulation, Canadian Survey on Disability, 2012.
Percentages are rounded to the nearest one decimal point.
E use with caution. Note: “Other” and “not specified” responses excluded.
3.3.2. Core housing need
The Canada Mortgage and Housing Corporation (CMHC) uses the concept of “core housing need,” which is made up of the following elements:
- Adequacy: the physical condition of the dwelling (e.g. whether housing is in need of major repairs)
- Suitability: whether the housing is of a suitable size and has enough bedrooms for the size and make-up of the household
- Affordability: whether it costs less than 30% of before-tax household income.
If a household cannot meet one of these standards, and is “unable to pay the median rent for alternative local housing meeting all standards without spending 30% or more of its before-tax income,” it is considered to be in core housing need.[22]
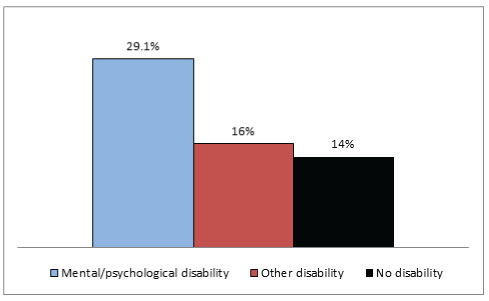
Figure 12. Core housing need of adults aged 15 and older by disability status, Ontario, 2006
Source: Adapted from Statistics Canada, Custom Tabulation, Participation and Activity Limitation Survey, 2006.
Percentages are rounded to the nearest one decimal point.
E use with caution. Note: Not stated/not applicable responses excluded.
In 2006, the proportion of Ontarians with mental health or addiction disabilities[23] who were in “core housing need” (29.1%) was more than twice that of people without disabilities (14%). People with other disabilities (16%) were somewhat more likely than people without disabilities (14%) to be in core housing need.
Table 13. Core housing need of adults aged 15 and over by disability status, Ontario and Canada, 2006
|
|
Ontario |
Canada |
||
|
Disability status |
Number |
% |
Number |
% |
|
Mental/ psychological disability |
77,470
|
29.1
|
177,510
|
30.1
|
|
Other disability |
240,950 |
16 |
565,500 |
15.5 |
|
No disability
|
1,122,040
|
14
|
2,446,060
|
11.5
|
Source: Adapted from Statistics Canada, Custom Tabulation, Participation and Activity Limitation Survey, 2006.
E use with caution.
Percentages are rounded to the nearest one decimal point. Note: “Not stated”/”not applicable” responses are excluded.
3.3.3. Dwelling structure
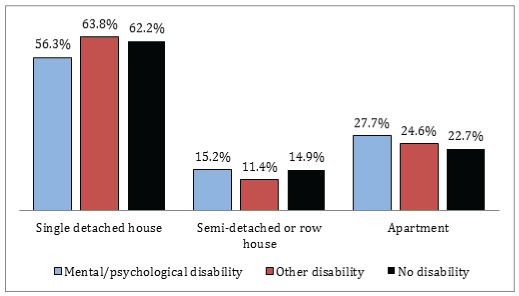
Figure 13. Adults, aged 15 and older by dwelling structure and disabilty status, Ontario, 2011
Source: Adapted from Statistics Canada, Custom Tabulation, Canadian Survey on Disability, 2012.
Percentages are rounded to the nearest one decimal point.
E use with caution.
Most people in Ontario live in single detached houses. However, a greater proportion of people with mental health or addiction disabilities in Ontario live in apartments (27.7%) compared to people with other disabilities (24.6%) and people without disabilities (22.7%).
At the national level, a greater proportion of people with mental health and addiction disabilities live in apartments than in Ontario (32.3% for Canada, 27.7% for Ontario) (see Tables 14 and 15).
Table 14. Adults, aged 15 and over by dwelling structure and disabilty status, Ontario, 2011
|
|
Ontario |
|||||
|
Disability |
Mental/psychological |
Other disability |
No disability |
|||
|
Dwelling structure |
Number |
% |
Number |
% |
Number |
% |
|
Single detached house |
287,540 |
56.3 |
727,860 |
63.8 |
5,641,080 |
62.2 |
|
Semi-detached |
77,550 |
15.2 |
130,630 |
11.4 |
1,352,740 |
14.9 |
|
Apartment
|
141,250 |
27.7 |
281,000 |
24.6 |
2,056,750 |
22.7 |
|
Other dwelling[24]
|
F |
F |
F |
F |
25,720 |
0.3 |
Source: Adapted from Statistics Canada, Custom Tabulation, Canadian Survey on Disability, 2012.
Percentages are rounded to the nearest one decimal point.
E use with caution.
F data supressed due to confidentiality. Note: “Not specified” responses are excluded.
Table 15. Adults, aged 15 and older by dwelling structure and disability status, Canada, 2011
|
|
Canada |
|||||
|
Disability |
Mental/psychological |
Other disability |
No disability |
|||
|
Dwelling structure |
Number |
% |
Number |
% |
Number |
% |
|
Single detached house |
565,620 |
53.4 |
1,675,870 |
61.7 |
14,685,570 |
61.9 |
|
Semi-detached or row house |
131,510 |
12.4 |
259,550 |
9.6 |
2,699,580 |
11.4 |
|
Apartment
|
341,960 |
32.3 |
733,790 |
27 |
6,075,720 |
25.6 |
|
Other dwelling
|
20,060E |
1.9E |
44,870 |
1.7 |
274,660 |
1.2 |
Source: Adapted from Statistics Canada, Custom Tabulation, Canadian Survey on Disability, 2012.
Percentages are rounded to the nearest one decimal point.
E use with caution. Note: “Not specified” responses are excluded.
3.3.4. Number of bedrooms
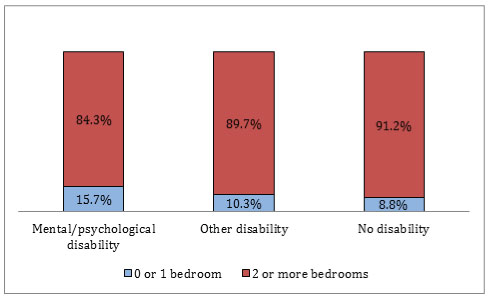
Figure 14. Adults, aged 15 and older by number of bedrooms and disabilty status, Ontario 2011
Source: Adapted from Statistics Canada, Custom Tabulation, Canadian Survey on Disability, 2012.
Percentages are rounded to the nearest one decimal point.
E use with caution.
A greater proportion of Ontarians with mental health and addiction disabilities, aged 15 and older, live in households that either have zero bedrooms (e.g. studio apartments) or one bedroom (15.7%) compared to people with other disabilities (10.3%) and people without disabilities (8.8%). Nationwide, a slightly higher proportion of people with mental health and addiction disabilities (17.4%) live in studio or one-bedroom apartments than in Ontario (15.7%) - See Tables 16 and 17.
Table 16. Adults, aged 15 and older by number of bedrooms and disabilty status, Ontario 2011
|
|
Ontario |
|||||
|
Disability |
Mental/psychological |
Other disability |
No disability |
|||
|
Number of |
Number |
% |
Number |
% |
Number |
% |
|
0 or 1 bedroom |
79,880 |
15.7 |
117,450 |
10.3 |
803,070 |
8.8 |
|
2 bedrooms
|
98,060 |
19.2 |
261,240 |
22.9 |
1,528,810 |
16.8 |
|
3 bedrooms
|
190,250 |
37.3 |
461,750 |
40.5 |
3,675,280 |
40.5 |
|
4 bedrooms
|
118,160 |
23.2 |
229,710 |
20.1 |
2,370,490 |
26.1 |
|
5 or more bedrooms |
23,930E |
4.7E |
71,190 |
6.2 |
698,640 |
7.7 |
Source: Adapted from Statistics Canada, Custom Tabulation, Canadian Survey on Disability, 2012.
Percentages are rounded to the nearest one decimal point.
E use with caution.
Table 17. Adults, aged 15 and older by number of bedrooms and disabilty status, Canada, 2011
|
|
Canada |
|||||
|
Disability |
Mental/psychological |
Other disability |
No disability |
|||
|
Number of |
Number |
% |
Number |
% |
Number |
% |
|
0 or 1 bedroom |
184,850 |
17.4 |
303,260 |
11.2 |
2,174,150 |
9.2 |
|
2 bedrooms
|
236,310 |
22.3 |
697,510 |
25.7 |
4,754,170 |
20 |
|
3 bedrooms
|
359,780 |
34 |
1,012,350 |
37.3 |
9,112,960 |
38.4 |
|
4 bedrooms
|
213,790 |
20.2 |
504,560 |
18.6 |
5,604,180 |
23.6 |
|
5 or more bedrooms |
64,870 |
6.1 |
198,150 |
7.3 |
2,094,820 |
8.8 |
Source: Adapted from Statistics Canada, Custom Tabulation, Canadian Survey on Disability, 2012.
Percentages are rounded to the nearest one decimal point.
E use with caution.
3.4. Education
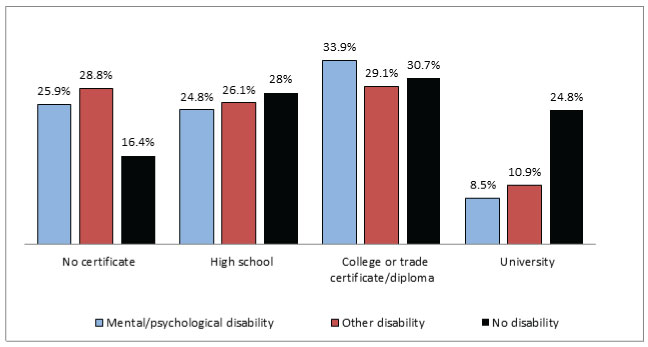
Figure 15. Educational attainment of adults aged 15 and older by highest level of education and disability status, Ontario, 2011
Source: Adapted from Statistics Canada, Custom Tabulation, Canadian Survey on Disability, 2012.
Percentages are rounded to the nearest one decimal point.
E use with caution. Note: These figures exclude institutional residents and survey respondents who did not state their highest level of education. Missing values are included. “Not specified” values are excluded from the graph.
Achieving education potential affects a person’s ability to take part in the labour market and their earning potential. Having post-secondary education is becoming increasingly important. Employment and Social Development Canada projects that two-thirds of job openings from 2011-2020 will be in occupations that generally require post-secondary education (college, university or vocational), or management occupations.[25]
Yet, over a quarter of Ontarians with mental health and addiction disabilities (25.9%) have no high school. This proportion is lower than that of people with other disabilities (28.8%) but substantially higher compared to people without disabilities (16.4%). At the national level, a slightly greater proportion of people with mental health and addiction disabilities have not completed high school (27.8%) compared to Ontario (25.9%).
The proportion of Ontarians without disabilities with a university degree (24.8%) is more than twice that of people with mental health and addiction disabilities (8.5%) or people with other disabilities (10.9%).
Ontarians with mental health and addiction disabilities are four times more likely to earn a college diploma or trade certificate (33.9%) than complete university (8.5%). For people with other disabilities, the proportion who earned a college diploma or trade certificate (29.1%) is more than twice that of the proportion who completed university (10.9%).
In Ontario, a greater proportion of people with mental health and addiction disabilities earned a college diploma or a trade certificate as their highest educational achievement (33.9%) than people with other disabilities (29.1%) and people with no disabilities (30.7%).
Almost a quarter of people in Ontario with mental health and addiction disabilities have discontinued their formal education or training because of their condition (24.1%). This is more than three times higher than the proportion of people with other disabilities who have discontinued their education because of their condition (6.4%) (see Table 20).
Table 18. Educational attainment of adults aged 15 and older by highest level of education and disability status, Ontario, 2011
|
|
Ontario |
|||||
|
Disability |
Mental/psychological |
Other disability |
No disability |
|||
|
Highest level of education |
Number |
% |
Number |
% |
Number |
% |
|
No certificate |
132,310 |
25.9 |
329,180 |
28.8 |
1,490,620 |
16.4 |
|
High school |
126,670 |
24.8 |
297,400 |
26.1 |
2,545,350 |
28 |
|
College diploma or trade certificate |
172,920 |
33.9 |
331,800 |
29.1 |
2,784,740 |
30.7 |
|
University |
43,480 |
8.5 |
124,770 |
10.9 |
2,248,650 |
24.8 |
Source: Adapted from Statistics Canada, Custom Tabulation, Canadian Survey on Disability, 2012.
Percentages are rounded to the nearest one decimal point.
E use with caution. Notes: These figures exclude institutional residents and survey respondents who did not state their highest level of education. Missing values are included. “Not specified” values are excluded from the table.
Table 19. Educational attainment of adults aged 15 and older by highest level of education and disability status, Canada, 2011
|
|
Canada |
|||||
|
Disability |
Mental/psychological |
Other disability |
No disability |
|||
|
Highest level of education |
Number |
% |
Number |
% |
Number |
% |
|
No certificate
|
294,570 |
27.8 |
792,840 |
29.2 |
4,214,960 |
17.8 |
|
High school
|
275,200 |
26 |
645,320 |
23.8 |
6,256,530 |
26.4 |
|
College diploma or trade certificate |
332,500 |
31.4 |
859,720 |
31.7 |
8,012,690 |
33.8 |
|
University
|
95,380 |
9 |
287,960 |
10.6 |
5,238,710 |
22.1 |
Source: Adapted from Statistics Canada, Custom Tabulation, Canadian Survey on Disability, 2012.
Percentages are rounded to the nearest one decimal point.
E use with caution. Notes: These figures exclude institutional residents and survey respondents who did not state their highest level of education. Missing values are included. “Not specified” values are excluded from the table.
Table 20. Discontinuation of formal education due to disability of adults aged 15 and older, by disability type, Ontario and Canada, 2011
|
|
Ontario |
Canada |
||
|
Disability type |
Number |
% |
Number |
% |
|
Mental/ |
109,220
|
24.1
|
117,510
|
24.8
|
|
Other disability |
56,820
|
6.4
|
78,910
|
6.1
|
Source: Adapted from Statistics Canada, Custom Tabulation, Canadian Survey on Disability, 2012.
Percentages are rounded to the nearest one decimal point.
E use with caution.
3.5. Labour force
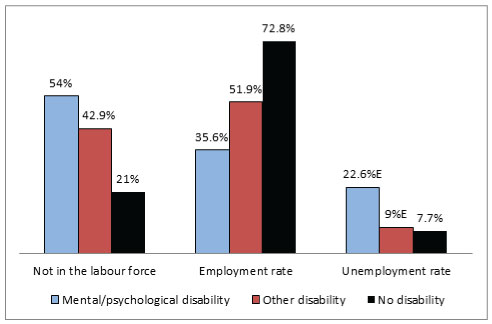
Figure 16. Labour force status of adults aged 15-64 by labour force category and disability status, Ontario, 2011
Source: Adapted from Statistics Canada, Custom Tabulation, Canadian Survey on Disability, 2012.
Percentages are rounded to the nearest one decimal point.
E use with caution. Notes: The totals represent the number of people in each category surveyed between the ages of 15-64. Percentages do not total 100.
Work can contribute to a person’s dignity, self-esteem and ability to take part in society. The United Nations’ Convention on the Rights of Persons with Disabilities recognizes the right of people with disabilities to work and the need for opportunities to make a living. Workplaces must be made inclusive and accessible to persons with disabilities. By ratifying the CRPD, Canada has agreed to take progressive steps to promote the right to work for people with disabilities.
This section examines three aspects of labour force data:
- The proportion of people not in the labour force
- The employment rate, and
- The unemployment rate.
3.5.1. Not in the labour force
In 2011 in Ontario, 54% of people with mental health and addiction disabilities between the ages of 15 and 64 (201,220 people) were not in the labour force, [26] compared to 42.9% of people with other disabilities and 21% for people without disabilities.
3.5.2. Employment rate
In 2011, the employment rate[27] of Ontarians aged 15-64 with mental health and addiction disabilities (35.6%) was much lower than for people with other disabilities (51.9%) and people without disabilities (72.8%).
The employment rate of people with mental health and addiction disabilities in Ontario was similar to the rate for this group across Canada (35.6% compared to 35.9%).
3.5.3. Unemployment rate
The unemployment rate[28] of Ontarians aged 15-64 with mental health or addiction disabilities in 2011 (22.6%) was more than twice as high as for Ontarians with other disabilities (9%), and almost three times higher than for Ontarians without disabilities (7.7%).
Table 21. Labour force status of adults aged 15-64 by disability status and labour force category, Ontario, 2011
|
|
Ontario |
||
|
Disability |
Mental/psychological |
Other disability |
No disability |
|
Labour force category |
% |
% |
% |
|
Not in the labour force
|
54 |
42.9 |
21 |
|
Employment rate
|
35.6 |
51.9 |
72.8 |
|
Unemployment rate
|
22.6E |
9E |
7.7 |
Source: Adapted from Statistics Canada, Custom Tabulation, Canadian Survey on Disability, 2012.
Percentages are rounded to the nearest one decimal point.
E use with caution. Note: Percentages do not total 100.
Table 22. Labour force status of adults aged 15-64 by disability status and labour force category, Canada, 2011
|
|
Canada |
||
|
Disbility |
Mental/psychological |
Other disability |
No disability |
|
Labour force status |
% |
% |
% |
|
Not in the labour force |
55.3 |
41.4 |
20.7 |
|
Employment rate |
35.9 |
53.5 |
73.6 |
|
Unemployment rate |
19.6E |
8.4 |
7.1 |
Source: Adapted from Statistics Canada, Custom Tabulation, Canadian Survey on Disability, 2012.
Percentages are rounded to the nearest one decimal point.
E use with caution. Note: Percentages do not total 100.
3.6. Discrimination at work
The Code prohibits discrimination in employment based on disability. Despite this protection, in the OHRC’s mental health consultation, participants identified workplace discrimination as a significant concern. Many people described being treated inequitably on the job, being dismissed, harassed or exposed to a poisoned environment, based on their mental health or addiction disabilities. The OHRC heard that many people did not receive the disability-related accommodations they needed in the workplace. Many were reluctant to disclose their disability because of concerns about discrimination, or concerns that their performance would be judged based on their disability.[29]
This section presents data on two aspects of discrimination at work:
- Perception of discrimination
- Providing workplace accommodation.
3.6.1. Perception of discrimination
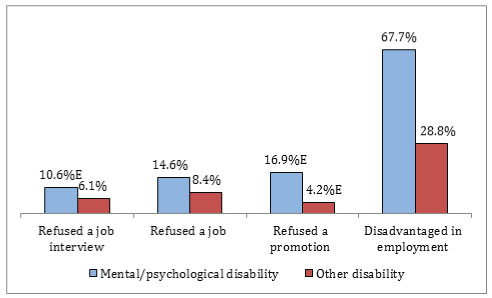
Figure 17. Perception of disability discrimination in the workplace among adults aged 15 and older by disability type and type of discrimination, Ontario, 2012
Source: Adapted from Statistics Canada, Custom Tabulation, Canadian Survey on Disability, 2012.
Percentages are rounded to the nearest one decimal point. Percentages do not total 100.
E use with caution. Note: Missing values are excluded.
The CSD asks if, in the last five years, people with disabilities believe that, because of their condition, they have been:
- Refused a job interview
- Refused a job
- Refused a promotion
- Disadvantaged in employment.
Many people with disabilities perceive they have been discriminated against in employment regardless of disability type. A substantially high proportion of people with mental health and addiction disabilities (67.7%) report being disadvantaged at work due to their condition. The same observation can be made when looking at Ontarians with mental health and addiction disabilities compared to people with mental health and addiction disabilities across Canada.
A higher proportion of Ontarians with mental health and addiction disabilities report workplace discrimination compared to Ontarians with other disabilities. This is seen across all types of workplace discrimination.
Table 23. Perception of disability discrimination in the workplace among adults aged 15 and older by disability type and type of discrimination, Ontario and Canada, 2012
|
|
Ontario |
Canada |
||||||
|
Disability |
Mental/psychological |
Other disability |
Mental/psychological |
Other disability |
||||
|
Type of discrimination |
Number |
% |
Number |
% |
Number |
% |
Number |
% |
|
Refused a |
25,610E |
10.6E |
30,060 |
6.1 |
63,690 |
12.5 |
69,860 |
5.7 |
|
Refused a job |
33,950 |
14.6 |
41,420 |
8.4 |
97,060 |
19.4 |
103,570 |
8.5 |
|
Refused a promotion |
39,630E |
16.9E |
20,890E |
4.2E |
74,540 |
14.8 |
61,610 |
5 |
|
Disadvantaged due to condition |
150,740 |
67.7 |
122,530 |
28.8 |
297,080 |
63.7 |
332,890 |
30.4 |
Source: Adapted from Statistics Canada, Custom Tabulation, Canadian Survey on Disability, 2012.
Percentages are rounded to the nearest one decimal point. Percentages do not total 100.
E use with caution. Note: Missing values are excluded.
3.6.2. Workplace accommodation
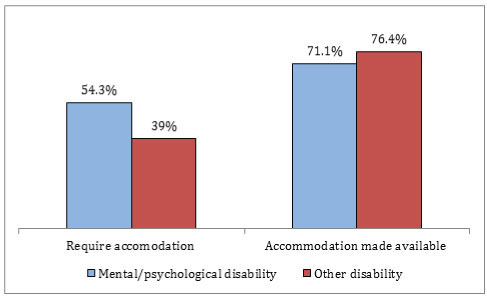
Figure 18. Workplace accommodation required and received by adults aged 15 and older by disability type, Ontario, 2012
Source: Adapted from Statistics Canada, Custom Tabulation, Canadian Survey on Disability, 2012.
Percentages are rounded to the nearest one decimal point.
E use with caution. Note: Missing values are excluded.
In Ontario, more than half of people with mental health and addiction disabilities said they needed some type of accommodation to be able to work.[30] A greater proportion of people with mental health and addiction disabilities report that they require workplace accommodation (54.3%) than people with other disabilities (39%). Overall, over 70% of people with disabilities who requested accommodation received it. People with other disabilities were more likely to receive the accommodation requested (76.4%) than people with mental health and addiction disabilities (71.1%).
People with mental health disabilities or addictions in Ontario (71.1%) are slightly more likely to receive workplace accommodation than their counterparts across Canada (67.9%) (see Tables 24 and 25).
Table 24. Workplace accommodation required by adults aged 15 and older by disability type, Ontario and Canada, 2012
|
|
Ontario |
Canada |
||||||
|
Disability |
Mental/psychological |
Other disability |
Mental/psychological |
Other disability |
||||
|
|
Number |
% |
Number |
% |
Number |
% |
Number |
% |
|
Require accommodation
|
142,770 |
54.3 |
193,330 |
39 |
298,440 |
55.1 |
468,950 |
38.3 |
Source: Adapted from Statistics Canada, Custom Tabulation, Canadian Survey on Disability, 2012.
Percentages are rounded to the nearest one decimal point.
E use with caution. Note: Missing values are excluded.
Table 25. Workplace accommodation received by adults aged 15 and older by disability type, Ontario and Canada, 2012
|
|
Ontario |
Canada |
||||||
|
Disability |
Mental/psychological |
Other disability |
Mental/psychological |
Other disability |
||||
|
|
Number |
% |
Number |
% |
Number |
% |
Number |
% |
|
Accommodation
|
71,840 |
71.1
|
124,450 |
76.4 |
142,410 |
67.9 |
289,010 |
75.3 |
Source: Adapted from Statistics Canada, Custom Tabulation, Canadian Survey on Disability, 2012.
Percentages are rounded to the nearest one decimal point.
E use with caution. Note: Missing values are excluded.
3.7. Income
During its mental health consultation, the OHRC heard that poverty is a pressing concern for Ontarians with mental health disabilities and addictions. Participants explained how discrimination, such as in employment and education, can contribute to poverty. At the same time, the OHRC heard that living in poverty can negatively affect people’s physical and mental health by contributing to people’s exclusion from society. The CRPD recognizes that people with disabilities tend to live in poverty. Article 28 outlines the right to an adequate standard of living and social protection, including food, clothing and housing, without discrimination because of disability.
This section looks at income levels and low-income status as indicators of economic inequality.
3.7.1. Income levels
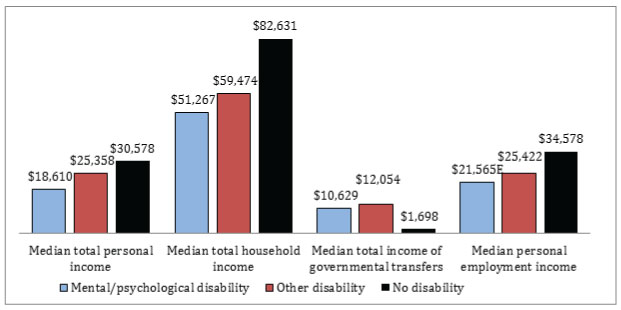
Figure 19. Median income of adults aged 15 and older by income type and disability status, Ontario, 2010
Source: Adapted from Statistics Canada, Custom Tabulation, Canadian Survey on Disability, 2012.
Percentages are rounded to the nearest one decimal point.
E use with caution.
With the exception of income from governmental transfers, Ontarians with mental health and addiction disabilities have a lower median income than people without disabilities.
In 2010, the median[31] personal income (from all income sources[32]) of people with mental health and addiction disabilities in Ontario was 39% lower than that of people without disabilities ($18,610 versus $30,578).[33]
The median income of households[34] where someone had a mental health or addiction disability ($51,267) was 38% lower than the median total income of households where members did not have disabilities ($82,631).
Ontarians with mental health and addiction disabilities received much more government income[35] (median was $10,629) than people without disabilities in 2010 (median was $1,698).
People with mental health and addiction disabilities also had 38% less income from employment[36] than people without disabilities (median was $21,565 versus median of $34,578).
Table 26. Median income of adults aged 15 and older by income type and disability status, Ontario, 2010
|
|
Ontario |
||
|
Disability |
Mental/psychological |
Other disability |
No disability |
|
Income type |
Amount ($) |
Amount ($) |
Amount ($) |
|
Median total personal income |
18,610 |
25,358** |
30,578 |
|
Median total household income |
51,267 |
59,474** |
82,631 |
|
Median total government income |
10,629 |
12,054** |
1,698 |
|
Median personal employment income |
21,565E |
25,422** |
34,578 |
Source: Adapted from Statistics Canada, Custom Tabulation, Canadian Survey on Disability, 2012.
Percentages are rounded to the nearest one decimal point.
E use with caution. ** comparisons between people with other disabilities and people with mental health and addiction disabilities are not significant.
Table 27. Median income of adults aged 15 and older by income type and disability status, Canada, 2010
|
|
Canada |
||
|
Disability |
Mental/psychological |
Other disability |
No disability |
|
Income type |
Amount ($) |
Amount ($) |
Amount ($) |
|
Median total personal income |
17,744 |
23,864 |
30,253
|
|
Median total household income |
49,103 |
55,489 |
77,890
|
|
Median total government income |
10,449 |
12,363 |
2,776 |
|
Median personal employment income |
18,720 |
25,432 |
33,379 |
Source: Adapted from Statistics Canada, Custom Tabulation, Canadian Survey on Disability, 2012.
Percentages are rounded to the nearest one decimal point.
E use with caution.
3.7.2. Low income status
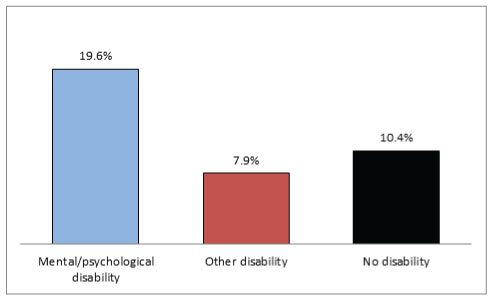
Figure 20. Low income status (after tax) of adults aged 15 and older by disability status, Ontario, 2010
Source: Adapted from Statistics Canada, Custom Tabulation, Canadian Survey on Disability, 2012.
Percentages are rounded to the nearest one decimal point.
E use with caution
In 2010, the proportion of people with mental health and addiction disabilities in Ontario in low income status [37] was 19.6% compared to 10.4% for people without disabilities. This proportion is more than two times greater than that of people with other disabilities (7.9%).
A slightly lower proportion of people with mental health and addiction disabilities in Ontario were in low income status (19.6%) in 2010 compared to people with mental health and addiction disabilities in Canada (21.5%).
Table 28. Low income status (after tax) of adults aged 15 and over by disability status, Ontario and Canada, 2010
|
|
Ontario |
Canada |
||
|
|
|
|||
|
Disability staus |
Number |
% |
Number |
% |
|
Mental/psychological disability |
99,950
|
19.6
|
227,850
|
21.5
|
|
Other disability |
89,830
|
7.9
|
257,750
|
9.5
|
|
No disability |
941,960
|
10.4
|
2,447,600
|
10.3
|
Source: Adapted from Statistics Canada, Custom Tabulation, Canadian Survey on Disability, 2012.
Percentages are rounded to the nearest one decimal point.
E use with caution.
[16] Statistics Canada, Canadian Survey on Disability, 2012: Concepts and Methods Guide, supra note 6 at 9; Human Resources and Skills Development Canada, Federal Disability Report: The Government of Canada’s Annual Report on Disability Issues, (Gatineau, Quebec: Her Majesty the Queen in Right of Canada, 2010) online: Government of Canada www.esdc.gc.ca/eng/disability/arc/federal_report2010/fdr_2010.pdf (retrieved July 9, 2015) .
[17] Statistics Canada, Canadian Survey on Disability, 2012: Concepts and Methods Guide, supra note 6 at 9.
[18] Includes First Nations peoples, Métis peoples and the Inuit. See the glossary for more information.
[19] Race is a “social construct.” The Report of the Commission on Systemic Racism in the Ontario Criminal Justice System defined racialization as “the process by which societies construct races as real, different and unequal in ways that matter to economic, political and social life.” Commission on Systemic Racism in the Ontario Criminal Justice System, Report of the Commission on Systemic Racism in the Ontario Criminal Justice System (Toronto: Queen’s Printer for Ontario, 1995) (Co-Chairs: D. Cole & M. Gittens) at 40-41. For more information, see Ontario Human Rights Commission, Policy and guidelines on racism and racial discrimination (Toronto: Queen’s Printer for Ontario, 2005), online: OHRC www.ohrc.on.ca/en/policy-and-guidelines-racism-and-racial-discrimination.
[20] See the definition of “racialized people” in the glossary for more information.
[21] This is called a “census family.” See the glossary for the definition.
[22] Jacqueline Luffman, “Measuring Housing Affordability” (2006) 7(11) November. Perspectives on Labour and Income, Statistics Canada Catalogue no. 75-001-XIE. Online: Statistics Canada www.statcan.gc.ca/pub/75-001-x/75-001-x2006111-eng.htm (retrieved April 22, 2015) at 16.
[23] In the PALS, this group was defined as people with “emotional disabilities.”
[24] “Other dwellings” include other single attached houses (e.g. a single dwelling attached to a non-residential structure such as a store or church, or to another residential structure such as an apartment building), mobile homes, and other moveable dwellings (such as houseboats or recreational vehicles). Adapted from Statistics Canada, National Household Survey Dictionary, 2011 (2013) Statistics Catalogue no. 99-000-X2011001. Online: Statistics Canada www12.statcan.gc.ca/nhs-enm/2011/ref/dict/99-000-x2011001-eng.pdf (retrieved April 22, 2015) at 183.
[25] Employment and Social Development Canada, no date. Canadian Occupational Projection System (COPS): Graph Descriptions of Imbalances. Last updated October 18, 2012. Online: Employment and Social Development Canada http://occupations.esdc.gc.ca/sppc-cops/c.4nt.2nt@-eng.jsp?cid=37 (retr… August 31, 2015).
[26] The “labour force” is made up of people who are employed and people who are unemployed; "unemployed" refers to people who are without work, but are available for work and are actively seeking work. People may be out of the labour force because their disability or workplace barriers prevent them from working or seeking work. They may be occupied with caregiving or other responsibilities, retired, not be looking for work, or attending school full or part-time. See the glossary for more information.
[27] The employment rate is calculated by dividing the number of people employed by the total population (aged 15-64). See the definition of “employed” in the glossary for more information.
[28] The unemployment rate is calculated by dividing the number of people who are unemployed (people looking for work) by the population in the labour force (people employed and people unemployed). See the definition of “unemployed” in the glossary for more information.
[29] These experiences are echoed by other research. For example, in one study that surveyed over 2,000 working Ontarians aged 18 and over, over one-third of respondents said that they would not tell their current manager if they had a mental health problem. Among the reasons for not disclosing were fear that it would affect their careers, fear of losing friends, and the bad experiences of others. CS Dewa, “Worker attitudes towards mental health problems and disclosure” (2014) 5 International J ournal of Occupational and Environmental Medicine Vol.5 No.4.
[30]The accommodation required could relate to a mental health or addiction disability or, where people reported multiple disability types, it could relate to another disability.
[31] The median income is the mid-point where, by definition, half of the population is above the median line and half falls below. The median income measure was chosen over the commonly used average/mean income, in part because median income provides better information about the distribution of income in the population.
[32] Total personal income is income from all sources, including self-employment income, wages and salaries, government income, retirement income, investments and no income. Because employment income tends to be higher than income from other sources (such as government or retirement income), the median total personal employment income figure is higher than the median total personal income.
[33] Income figures represent income before tax.
[34] The total household income is the sum of the total incomes of all members of that household. See the glossary for more information.
[35] Government income includes Canada Pension Plan benefits, Employment Insurance benefits, child benefits, Guaranteed Income Supplement, and other income from government sources. It could also include income from social assistance.
[36] See the glossary for a detailed definition of “personal employment income.”
[37]Statistics Canada used the Low-Income Cut Off (after tax) to calculate these figures (LICO-AT). Although Canada has no official “poverty line,” LICOs are one measure of low income. According to Statistics Canada, “a LICO is an income threshold below which a family will likely devote a larger share of its income on the necessities of food, shelter and clothing than the average family. The approach is essentially to estimate an income threshold at which families are expected to spend 20 percentage points more than the average family on food, shelter and clothing.” In, Statistics Canada, 2009, Low income cut-offs for 2008 and low income measures for 2007. Statistics Canada Catalogue no. 75F0002M – No. 002. Ottawa, Ontario. Income Research Paper Series. Online: Statistics Canada www.statcan.gc.ca/pub/75f0002m/75f0002m2009002-eng.pdf (retrieved May 25, 2015) at 7. Therefore, if the average family of four in a medium-sized city spent 43% of their after-tax income on food, clothing and shelter in 1992, families with incomes below the LICO-AT are spending more than 63% of their after-tax income on these necessities. LICO-ATs for family units in Canadian communities can be found at Statistics Canada, no date. Table 1 Low income cut-offs (1992 base) after tax (table). Statistics Canada Catalogue. Ottawa, Ontario. Last updated June 27, 2013. Online: Statistics Canada www.statcan.gc.ca/pub/75f0002m/2013002/tbl/tbl01-eng.htm (retrieved May 26, 2014). LICOs differ depending on the size of the community and the size of the family unit. For example, in a Census Metropolitan Area of 500,000 inhabitants or more, the 2012 LICO-AT for one person was $19,597. LICOs are limited in that they are still based on 1992 figures of family consumption patterns and are only adjusted for inflation. They also do not apply to peoples living on First Nations reserves or economic families or unattached individuals in the Yukon and the Northwest Territories. See Statistics Canada, Low Income Lines, 2011-2012. Statistics Canada Catalogue no. 75F0002M – No. 002, Ottawa: Ontario. Income Research Paper Series. 75F0002M. 2013. Online: Statistics Canada www.statcan.gc.ca/pub/75f0002m/75f0002m2013002-eng.htm (retrieved August 20, 2015); Brian Murphy, Xuelin Zhang & Claude Dionne, 2012, Low Income in Canada: a Multi-line and Multi-index Perspective. Statistics Canada Catalogue no. 75F0002M – No. 001. Ottawa, Ontario. 112 p. Income Research Paper Series. Online: Statistics Canada www.statcan.gc.ca/pub/75f0002m/75f0002m2012001-eng.pdf (retrieved May 26, 2015), at 38; Statistics Canada, Special tabulation, based on Canadian Survey on Disability, 2012.