Tables
Table 1: New Complaints Filed by Social Area and Grounds Cited
Total Number of New Complaints: 2,399
|
|
Percent of Total Complaints Filed |
Percent of Grounds Cited |
Total Grounds |
Vocational Associations |
Services |
Employment |
Contracts |
Accommodations |
|
Age |
7.67% |
4.01% |
184 |
2 |
27 |
146 |
1 |
8 |
|
Ancestry |
5.96% |
3.12% |
143 |
2 |
32 |
101 |
|
8 |
|
Association |
1.17% |
0.61% |
28 |
1 |
8 |
14 |
|
5 |
|
Breach of Settlement |
0.29% |
0.15% |
7 |
|
2 |
5 |
|
|
|
Citizenship |
1.38% |
0.72% |
33 |
1 |
4 |
24 |
1 |
3 |
|
Creed |
4.38% |
2.29% |
105 |
4 |
24 |
70 |
|
7 |
|
Disability |
55.94% |
29.24% |
1342 |
24 |
201 |
1067 |
|
50 |
|
Ethnic Origin |
13.09% |
6.84% |
314 |
13 |
73 |
218 |
1 |
9 |
|
Family Status |
4.46% |
2.33% |
107 |
1 |
19 |
63 |
|
24 |
|
Marital Status |
2.21% |
1.15% |
53 |
1 |
12 |
34 |
|
6 |
|
Place of Origin |
11.05% |
5.77% |
265 |
11 |
54 |
189 |
|
11 |
|
Public Assistance |
0.33% |
0.17% |
8 |
|
1 |
|
|
7 |
|
Race & Colour |
30.64% |
16.01% |
735 |
15 |
205 |
494 |
1 |
20 |
|
Record of Offences |
0.21% |
0.11% |
5 |
|
|
5 |
|
|
|
Reprisal |
12.42% |
6.49% |
298 |
6 |
11 |
274 |
1 |
6 |
|
Sex & Pregnancy |
27.84% |
14.55% |
668 |
3 |
47 |
602 |
1 |
15 |
|
Sexual Harassment |
8.71% |
4.55% |
209 |
|
11 |
194 |
|
4 |
|
Sexual Orientation |
3.58% |
1.87% |
86 |
2 |
16 |
64 |
|
4 |
|
Sum of Categories |
|
100% |
4590 |
86 |
747 |
3564 |
6 |
187 |
|
Total Complaints Per Social Area |
|
|
2399 |
43 |
369 |
1885 |
2 |
100 |
|
Percentage of all Complaints |
|
|
100% |
1.79% |
15.38% |
78.57% |
0.08% |
4.17% |
*Note: Because complaints can involve multiple grounds, the sum by grounds exceeds the total for all complaints filed, and the corresponding percentages of total complaints exceed 100%.
Table 2: Settlements by Ground in Cases Mediated and Conciliated in 2004/2005
|
|
Mediated |
Conciliated |
Total Cases Settled |
||||||
|
Ground |
Cases |
Monetary Damages |
Average |
Cases |
Monetary Damages |
Average |
Cases |
Settlements |
Average |
|
Age |
37 |
$366,810.00 |
$9,913.78 |
9 |
$40,500.00 |
$4,500.00 |
46 |
$407,310.00 |
$8,854.57 |
|
Ancestry |
26 |
$113,569.37 |
$4,368.05 |
4 |
$13,908.56 |
$3,477.14 |
30 |
$127,477.93 |
$4,249.26 |
|
Association |
5 |
$19,900.00 |
$3,980.00 |
0 |
0 |
n/a |
5 |
$19,900.00 |
$3,980.00 |
|
Breach of Settlement |
1 |
$24,000.00 |
$24,000.00 |
0 |
$2,590.15 |
$863.38 |
1 |
$24,000.00 |
$24,000.00 |
|
Citizenship |
2 |
$3,250.00 |
$1,625.00 |
0 |
$289,416.00 |
$5,168.14 |
2 |
$3,250.00 |
$1,625.00 |
|
Creed |
18 |
$91,565.37 |
$5,086.97 |
3 |
$2,590.15 |
$863.38 |
21 |
$94,155.52 |
$4,483.60 |
|
Disability |
328 |
$2,245,744.81 |
$6,846.78 |
56 |
$289,416.00 |
$5,168.14 |
384 |
$2,535,160.81 |
$6,601.98 |
|
Ethnic Origin |
54 |
$334,626.37 |
$6,196.78 |
7 |
$55,908.56 |
$7,986.94 |
61 |
$390,534.93 |
$6,402.21 |
|
Family Status |
22 |
$177,650.00 |
$8,075.00 |
8 |
$18,400.00 |
$2,300.00 |
30 |
$196,050.00 |
$6,535.00 |
|
Marital Status |
14 |
$88,400.00 |
$6,314.29 |
3 |
$28,800.00 |
$9,600.00 |
17 |
$117,200.00 |
$6,894.12 |
|
Place of Origin |
47 |
$250,242.00 |
$5,324.30 |
6 |
$27,658.56 |
$4,609.76 |
53 |
$277,900.56 |
$5,243.41 |
|
Public Assistance |
1 |
$750.00 |
$750.00 |
1 |
$1,000.00 |
$1,000.00 |
2 |
$1,750.00 |
$875.00 |
|
Race & Colour |
127 |
$857,174.83 |
$6,749.41 |
18 |
$146,567.12 |
$8,142.62 |
145 |
$1,003,741.95 |
$6,922.36 |
|
Record of Offences |
1 |
$15,000.00 |
$15,000.00 |
0 |
0 |
n/a |
1 |
$15,000.00 |
$15,000.00 |
|
Reprisal |
51 |
$390,993.67 |
$7,666.54 |
13 |
$74,508.56 |
$5,731.43 |
64 |
$465,502.23 |
$7,273.47 |
|
Sex & Pregnancy |
150 |
$884,443.51 |
$5,896.29 |
38 |
$147,214.92 |
3,874.08 |
188 |
$1,031,658.43 |
$5,487.54 |
|
Sexual Harassment |
66 |
$523,501.67 |
$7,931.84 |
16 |
$51,935.00 |
$3,245.94 |
82 |
$575,436.67 |
$7,017.52 |
|
Sexual Orientation |
19 |
$84,770.00 |
$4,461.58 |
7 |
$15,000.00 |
$2,142.86 |
26 |
$99,770.00 |
$3,837.31 |
|
Total for All Grounds |
969 |
n/a |
n/a |
189 |
n/a |
n/a |
1158 |
n/a |
n/a |
|
Total Cases |
546 |
$3,558,600.65 |
$6,517.58 |
102 |
$424,729.63 |
$4,164.02 |
$648 |
$3,983,330.28 |
$6,147.11 |
*Note: Because complaints can involve multiple grounds, the sum by grounds exceeds the total for all complaints filed, and the corresponding percentages of total complaints exceed 100%.
Table 3: Complaints Closed by Disposition and Grounds
Total Number of Complaints Closed: 2,215
|
|
Percentage |
Total |
Withdrawn |
Settled |
Resolved |
Referred to Human Rights Tribunal |
Not Deal With (Sec.34) |
Failure to Provide Evidence |
Dismissed (Sec.36(2)) |
|
Age |
4.05% |
163 |
25 |
66 |
22 |
8 |
16 |
1 |
25 |
|
Ancestry |
3.18% |
128 |
13 |
46 |
20 |
2 |
13 |
2 |
32 |
|
Association |
0.70% |
28 |
2 |
8 |
6 |
4 |
4 |
|
4 |
|
Breach of Settlement |
0.10% |
4 |
|
|
|
|
|
|
1 |
|
Citizenship |
0.47% |
19 |
|
|
|
|
|
|
6 |
|
Creed |
2.16% |
87 |
|
|
|
|
|
|
13 |
|
Disability |
32.31% |
1299 |
|
|
|
|
|
|
141 |
|
Ethnic Origin |
5.92% |
238 |
24 |
87 |
25 |
14 |
31 |
4 |
53 |
|
Family Status |
2.61% |
105 |
22 |
43 |
11 |
6 |
10 |
1 |
12 |
|
Marital Status |
1.22% |
49 |
4 |
20 |
6 |
3 |
3 |
1 |
12 |
|
Place of Origin |
5.27% |
212 |
29 |
82 |
20 |
14 |
22 |
4 |
41 |
|
Public Assistance |
0.30% |
12 |
|
7 |
2 |
|
1 |
|
2 |
|
Race & Colour |
13.78% |
554 |
58 |
233 |
58 |
44 |
48 |
14 |
99 |
|
Record of Offences |
0.02% |
1 |
|
1 |
|
|
|
|
|
|
Reprisal |
5.67% |
228 |
38 |
92 |
32 |
10 |
17 |
1 |
38 |
|
Sex & Pregnancy |
15.42% |
621 |
108 |
290 |
83 |
43 |
31 |
5 |
61 |
|
Sexual Harassment |
5.00% |
201 |
27 |
117 |
25 |
6 |
8 |
2 |
16 |
|
Sexual Orientation |
1.82% |
73 |
10 |
33 |
8 |
11 |
4 |
3 |
4 |
|
Sum of Categories |
100% |
4022 |
563 |
1753 |
488 |
256 |
350 |
52 |
560 |
|
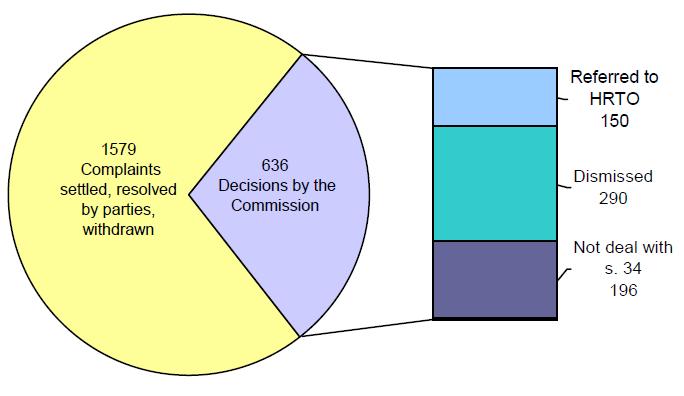
Total by disposition |
|
2215 |
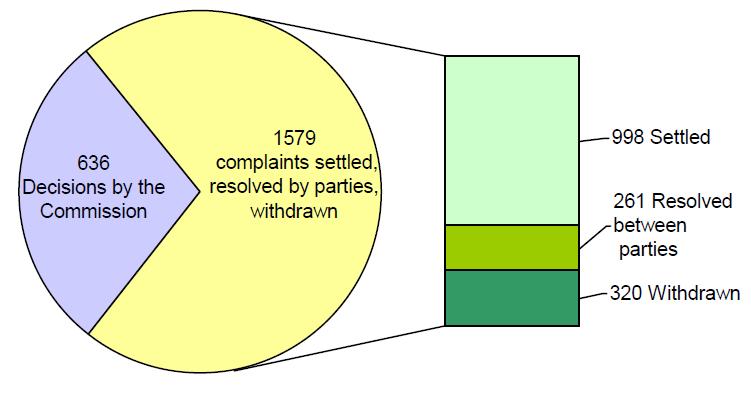
320 |
998 |
261 |
150 |
196 |
28 |
262 |
|
Percentage of all Complaints |
|
100% |
14.45% |
45.08% |
11.79% |
6.73% |
8.85% |
1.26% |
11.83% |
Note: Because complaints can involve multiple grounds, the sum by grounds exceeds the total for all complaints filed.
Table 4: Complaints Closed by Disposition and Social Area
Total Number of Complaints Closed: 2,215
|
Dismissed (Sec. 36(2)) |
15 |
1 |
161 |
83 |
2 |
262 |
11.83% |
|
Failure to Provide Evidence |
2 |
|
24 |
2 |
|
28 |
1.26% |
|
Not Deal With (Sec. 34) |
8 |
2 |
145 |
35 |
6 |
196 |
8.85% |
|
Referred to Human Rights Tribunal |
4 |
|
60 |
84 |
2 |
150 |
6.73% |
|
Resolved |
11 |
|
205 |
35 |
8 |
261 |
11.79 |
|
Settled |
42 |
2 |
859 |
85 |
11 |
998 |
45.08 |
|
Withdrawn |
18 |
1 |
275 |
25 |
2 |
320 |
14.45 |
|
Total |
100 |
6 |
1729 |
349 |
31 |
2215 |
100% |
|
Percentage |
4.52% |
0.27% |
78.09% |
15.72% |
1.40 |
100% |
|
|
|
Accommodation |
Contract |
Employment |
Services |
Vocational Associations |
Sum of Categories |
Percentage of all complaints |
Resolved Cases: Details on Settlement
Breakdown of Commission Decisions